
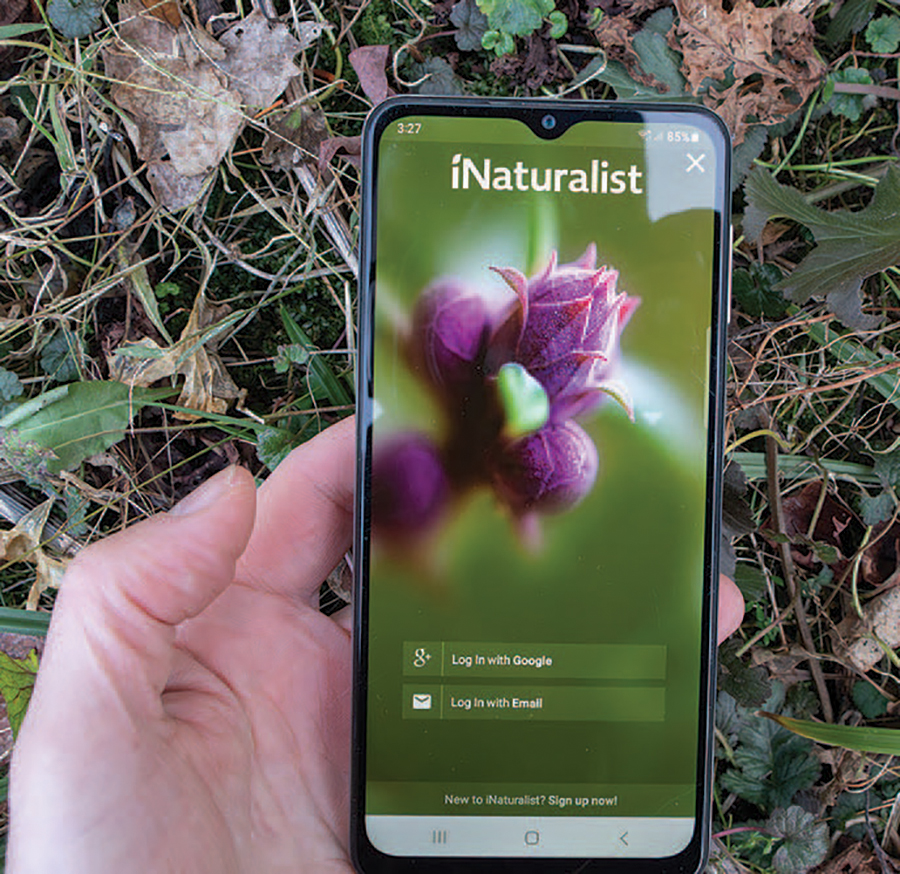
Developed in 2008 by three students at University of California Berkeley’s School of Information as a final master’s product, iNaturalist is a digital platform for nature enthusiasts to document and share their outdoor observations. As users logged their observations and the popularity of the smartphone application grew and spread around the globe (more than 3 million people worldwide have logged observations), scientists began to recognize the potential of the data generated to monitor ecosystems, map species distributions, and even to identify previously undocumented organisms. An analysis published online in July 2025 in the journal BioScience quantifies this usage, revealing the extent to which iNaturalist has evolved into an important tool for biodiversity science.
An international team of researchers, led by Brittany Mason from University of Florida, conducted a comprehensive review of the scientific literature to understand how and to what degree scientists leverage iNaturalist data for use in peer-reviewed publications. They compiled and classified more than 2,300 scientific papers that either used or discussed data from iNaturalist between its launch and 2022. The authors tagged each paper for its geographic scope, taxonomic focus, analytical approach, and research objectives. The resulting database – included as a supplementary table in the paper – offers a detailed view of how community science data are shaping biodiversity research.
The results reveal a steep and ongoing increase in both public and scientific engagement with the platform. Between 2015 and 2022, the number of publications using iNaturalist data grew exponentially, reaching more than 1,400 in 2022 alone. The authors found that studies using iNaturalist data can generally be grouped into a handful of categories. The largest share of studies relies on iNaturalist records to model or describe species distributions and range shifts, often as part of climate or land-use change assessments. Others analyze community composition, biodiversity trends, or behavioral and phenological patterns derived from photo timestamps. A smaller but fast-growing segment of studies uses iNaturalist imagery to train computer programs to identify objects within digital images or to extract morphological traits directly from photos.
(One example of a recent paper using iNaturalist data is an April 2025 article in the Journal of Agricultural and Urban Entomology that examines host plant usage by the different developmental stages of the invasive spotted lanternfly. In that study, the authors used photographs uploaded to iNaturalist from the New York City metropolitan area to determine which host plants in the city were most commonly associated with the egg, nymph, and adult stages.)
The BioScience analysis also highlights the geographic and taxonomic scope of iNaturalist research. Studies have drawn on data from at least 128 countries, although usage remains concentrated in North America. Despite that geographic bias, the authors found that papers from Africa, Asia, and South America appear more frequently than expected relative to their raw observation counts, suggesting that iNaturalist data are helping fill gaps in regions with limited biodiversity monitoring infrastructure. Taxonomically, vertebrates dominate the iNaturalist-associated literature, particularly reptiles, amphibians, and mammals, which are overrepresented compared to their share of total observations. Birds appear less often, likely because birders use eBird, another community science data-recording platform exclusively for birds.
The authors note that the use of iNaturalist data has limitations due to uneven sampling effort across regions, seasons, and taxa, as well as variable identification accuracy (some taxa are easier to identify than others). However, the study demonstrates that the iNaturalist database is a widely used source of ecological information, linking public participation to global biodiversity monitoring in ways not previously possible.