
One floor above the taxidermied polar bears and crocodiles, in an annex adjacent to the eclectic collection of geological wonders and historical artifacts from faraway places, the Fairbanks Museum’s Wildflower Table sits from April through September, displaying blossoms collected nearby. Before she arranges these flowers for perusal by visitors, the St. Johnsbury, Vermont, museum’s Director of External Relations Anna Rubin identifies each to species, labels them with both common and scientific names, and – perhaps most importantly – notes the first bloom date.
It is that bit of information – when each species first flowers in a given year – that has inspired collaboration with academic researchers. A new exhibition combines the history of the Wildflower Table with what the data volunteers have collected since 1903 may reveal about the present – and the future.
“These records began as part of a Victorian fascination with the natural world, particularly the seasonal cycles of northern New England,” said Rubin. Now, more than 120 years later, the wildflower data, combined with the museum’s temperature records, offer insight into how changes to the climate are affecting local phenology.
“Those long-term records are especially valuable in a place like New England, where we have such variation from year to year in our temperatures,” said Amanda Gallinat, an assistant professor of environmental studies at Colby College in Waterville, Maine. “Having a really long-term record gives us a sense of overall change in spite of that year-to-year variation. But it also gives us a lot of variation to work with when we’re trying to explain why seasons are changing the way they are.”
Since earning her PhD at Boston University in 2018, Gallinat has continued to collaborate with her advisor there, Richard Primack, an ecologist with a focus on phenology. That work involves examining historical records, including Henry David Thoreau’s recorded observations from Walden Pond in Concord, Massachusetts. When Primack and Gallinat learned of the first bloom records at Fairbanks Museum, they were eager to collaborate. Students in Gallinat’s Phenology: Ecology of the Seasons class in the spring semester of 2025 helped with the museum’s ongoing digitization process and analyzed data related to spring-blooming plants. Some students took deeper dives in to that data and analysis – comparing the St. Johnsbury data to the Concord data, analyzing bird records also discovered at Fairbanks, and connecting plant and bird data to insect records to see how they all may be connected.
The process of digitizing the information from a century worth of ledgers and notecards began in 2021, when Rubin collaborated with Allison Gulka-Millard, who has worked at the museum in various roles, and students at Middlebury College to format nearly half of the first bloom records according to Darwin Core, an internationally accepted biodiversity data standard. A 2024 grant from the Stockman Family Foundation funded the continuation of the data processing and digitization work and development of the new Wildflower Table display.
Even as they move data into a modern platform, however, the essence of the Wildflower Table remains much as it was in the early 1900s.
Gathering Flowers – and Data

“Certain processes, like washing vases, storing labels, and arranging plants, had been done a certain way for decades,” said Gulka-Millard, whose work at the museum has included helping with the Wildflower Table and recording first bloom dates. “It was amazing to think about taking part in the same rituals and traditions that volunteers and staff had established so long ago, and what stories these notecards and ledgers might hold.”
Rubin, who took over the Wildflower Table curator role in 2023, learned these rituals and patterns from former curator Joanne Adams, who had learned from Ruth Crane. And so it has been through the decades, knowledge passing from one person to the next. The “ritual” Gulka-Millard notes involves gathering flowers, identifying them, and displaying the blooms in glass vases on the same tables used a century ago.
“It all starts with natural history, an eagerness, a willingness to go out and observe,” Gallinat said. “I hope that’s something my students picked up on.”
Rubin currently works with six volunteers to collect, document, and display flowers from within a 30-mile radius of the museum. Once or twice each week, from April through September, the collectors arrive at the museum with 5-gallon buckets filled with mason jars and other vessels used to protect and transport the flowers. (If they find a threatened or endangered species – or one that is not plentiful in a particular area – they take a photograph instead, allowing that plant to be recorded without being collected.)
“They are extremely knowledgeable in their particular area,” Rubin said. “They know the forests and the fields and the wetlands and when things bloom. Most of them have been mentored by other volunteers.”
A custodial closet adjacent to the display area contains shelving that holds about a dozen field guides for reference, scores of glass vases in a range of sizes, and a long-spouted metal watering can that has been passed along the line of curators. It is here that Rubin examines each specimen, using leaf, stem, and flower features to confirm the species. Once she’s identified a specimen to species, Rubin records it, attaches the appropriate label (with common and scientific name), and selects the right vase for displaying it.
“I try to group things by family and give the table a little sense of order,” she said.
“The most important collection is the first bloom, and this is the only date recorded,” Rubin said. “However, for the display to show the variety and abundance of wildflowers, some species are collected well past the first bloom. Knapweeds, fleabanes, daisies, goldenrods, and asters often stay on the tables for several weeks.”
Flower Power

In an average year, the museum logs about 400 species, and over the years, collectors have recorded a total of some 700 species, including grasses and mosses. That extensive record has turned out to be a valuable data set.
“Because this is a volunteer group, sometimes [what we collect and record] depends on who’s collecting. If they happen to go to a place where there are little microclimates and things bloom earlier, then we get an early year. If somebody is sick or doesn’t go out, it may not get collected until later,” Rubin said. “The reason we could work with confidence with this academic group to make sense of this is because of the sheer volume of the record – we’ve been doing it for over 100 years.”
Gallinat agrees. “Whenever we have someone collecting data from plants in the wild, there are going to be some discrepancies,” she said. “But these are impressive records. The signal of climate change is so strong. It’s in line with what we expect, but it was surprising to see just how consistent that was.”
Gallinat’s students continued the process of digitizing the data, focusing first on early season species, which tend to be most responsive to temperature changes. The class was focused on seasonal ecology, which included studying the scientific literature and looking at long-term records from around the world.
“While students were reading about long-term shifts in flowering times and temperature, we were also doing this analysis” of the Fairbanks data, Gallinat said. “It felt really appropriate that we had an opportunity to contribute to those kinds of records in the scientific literature.”
Each student analyzed five species, examining how their flowering shifted over time and how they responded to temperature. That gave us a chance to talk about differences among species, why some species might be shifting more than other species, how things like changes in population sizes can contribute to shifts,” Gallinat said. “We also saw really consistently that shifts with temperature were much stronger than shifts over time. We see lots and lots of variation among years, with many species getting earlier over time on average.”
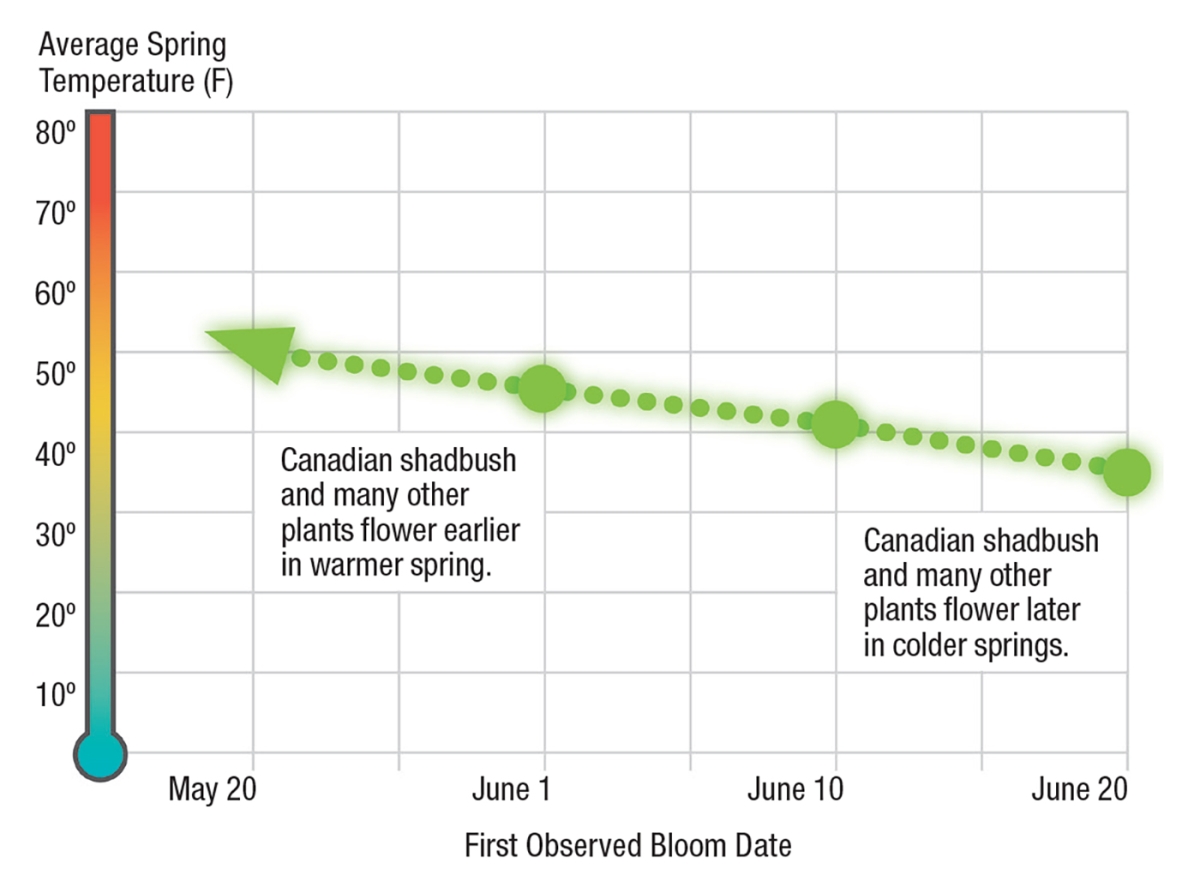
Of the 60 spring-blooming species they studied, 23 have first bloom dates that have shifted earlier since 1903. And 57 – or 95 percent – flower significantly earlier in warmer years.
In their independent research projects, some students used data from the Wildflower Table records to look more deeply at potential phenological effects. One analyzed the bird records from Fairbanks, which the class had also helped digitize. Another connected the Fairbanks data with data from Concord, Massachusetts. And another used records from the Global Biodiversity Information Facility (GBIF) to explore whether there has been a change of when pollinators emerge in northern Vermont.
“One of the major concerns we have about seasonality shifting with warming temperatures is that not everyone will shift in the same way – so in the same direction or at the same magnitude,” Gallinat said. “Plant phenology can be a really important indicator of insect phenology. And insects, as we know, are really important for migratory birds in the spring as they are returning, gathering strength, building their nests, and feeding their young. What we found from [the Fairbanks] records is that while the majority of plants were shifting with warming temps and blooming earlier with warming temperatures, birds were not doing the same. Some birds were shifting earlier, some shifting later, and some not changing at all. It suggests that there is capacity for mismatch, or asynchrony between the birds and the plants.”
A Story of Change

Using some of these findings, the museum has created six large interpretive panels to complement the Wildflower Table display. These panels include information about how the table started and has continued, and also offer text and graphics to explain how the records from more than a century ago are informing researchers now.
“The story here for me is about change. New England kind of defines itself as this region where the weather is constantly changing, and we think of climate as being kind of stable, but it really isn’t,” said Rubin. “The change in plants at first seems subtle, but those changes could really affect how the landscapes behave and everything that inhabits the land.”
As winter set in, Gallinat was already thinking of a field trip to Fairbanks Museum with her upcoming spring semester phenology course.
“I think there’s still so much we can do with this data set. We’ve digitized more species since we did this initial analysis, so being able to compare species that flower early in the season to middle and late season would be really worthwhile,” she said. “There are a lot of questions still to be answered with this data set, so I would certainly like to continue engaging as we move forward. The next step is for us to write this up into a scientific publication to make sure that the analysis reaches an even wider scientific audience.”
For the museum, that excitement around information carefully recorded over more than a century is gratifying.
“We did question before this project whether a ‘citizen science’ project such as this could actually yield scientifically meaningful results,” said Gurka-Millard. “And the answer is a resounding ‘Yes!’”
Discussion *