While driving down from Isle La Motte in early December, my son and I noticed a fine skim of ice floating down the Alburg Passage. As it collided with the Route 2 bridge supports, it broke into rectangular fragments. I wondered if what I was seeing was typical, or a symptom of changing climate? But a single observation tells you only about the current weather, and says nothing about climate trends.
To understand long-term patterns requires long-term data. So I reviewed ice formation data on Lake Champlain. I learned that between 1816 and 1916, the lake was “closed” to navigation in 96 of 100 winters. In the last 30 winters, the lake has closed 13 times, and just three times this past decade. At first blush, this might seem like overwhelming evidence for less ice, but again, this is not the whole story.
The 200-year data set was gathered by three different governmental agencies, a Burlington public official and historian, and a “cooperative weather observer.” Consistency might be a bit much to expect and “closed to navigation” could range from an ice passage from Burlington to Plattsburgh, or simply frozen harbors.
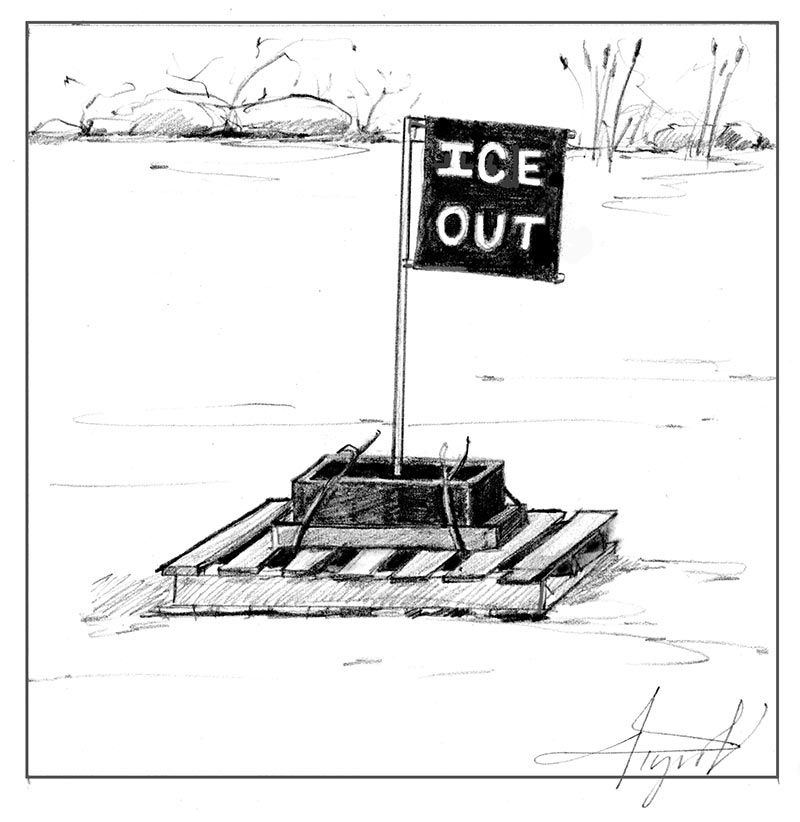
For a more consistently measured data set, Dr. Alan Betts, a Vermont climatologist, looked to the Joe’s Pond Association. Each winter for more than two decades, association members have placed a wooden pallet on the ice of Joe’s Pond in West Danville, Vermont. A cinderblock sits on the pallet and is strung to the plug of an electric clock on Homer Fitts' deck. For a small donation to the association, you too can guess when the ice will give way, the cinderblock sink, and the clock be unplugged; best guess wins!
The simplicity and consistency of this measurement technique is precisely what peaked Betts’ interest. Across the short interval of twenty years, there’s a clear trend; the cinderblock sinks about 6 days earlier than it did two decades ago.
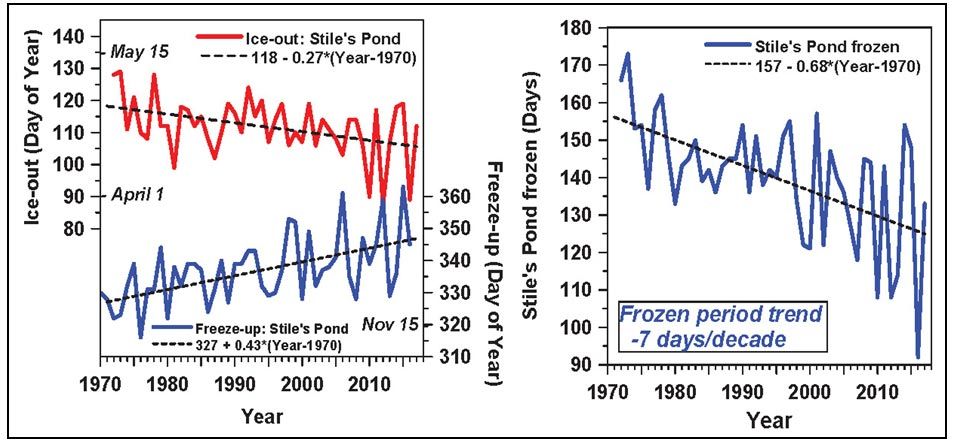
Betts has also reviewed 40 years of ice-out data from the Fairbanks Museum and found the same pattern: the ice on Stiles Pond goes out about three days earlier per decade. Every decade, on average, the pond has frozen four days later, and the total frozen period has been shrinking by seven days per decade since 1970.
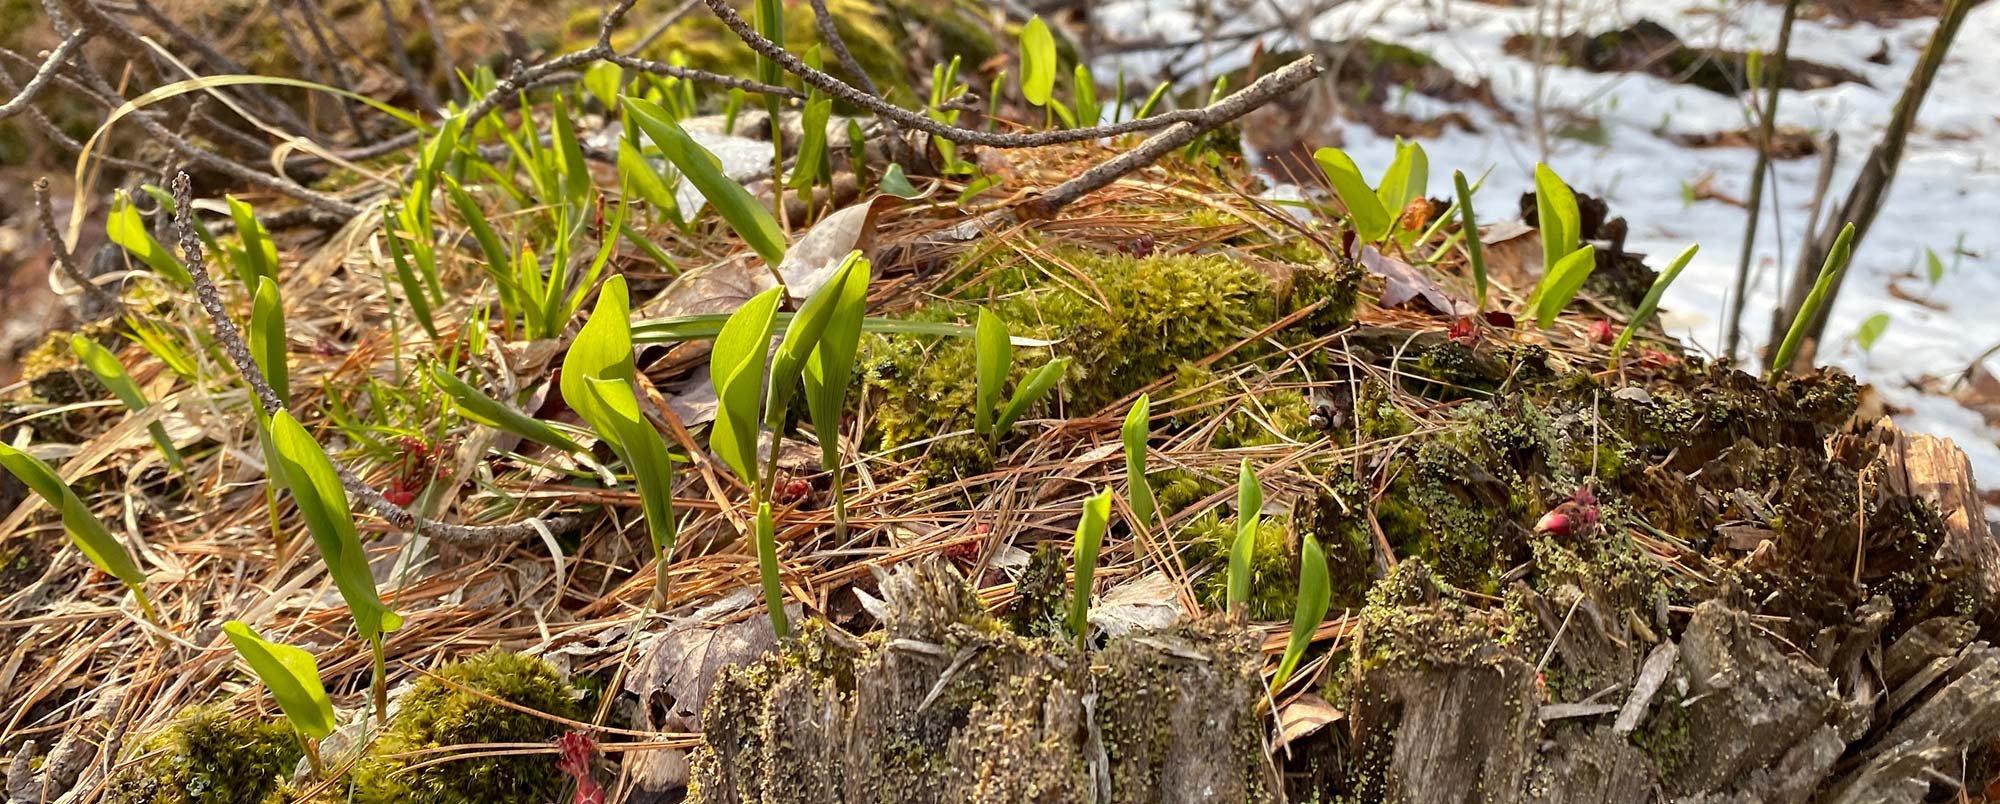
“Ice out” patterns are consistent with other indicators of change. For example, Betts has reviewed data on Vermont’s lilac flowering dates. On average, lilac leaves are developing about two weeks earlier than they did in the 1960s, and flowers open more than a week earlier.
With the greatest respect to ice and lilac, I suspect that some Vermonters might be more interested in changes in maple sugaring; this thought has not been wasted on Vermont scientists. Justin Guilbert and Vermont EPSCoR collaborators examined climate trends and predicted 11 fewer maple sugaring days by mid-century. They also predicted a shift in the sugaring season towards the midwinter months of December and January.
If at this point, you’re thinking that these trends are awfully short-term, and that anyone trying to predict the future of sugaring is walking on thin ice, you have a valid point; one of the difficulties of predicting climate change and its effects is the complexity of factors, including the background “noise” of our naturally variable weather conditions. This is, after all, a region which prides itself on the notion that, “if you don’t like the weather, wait a few minutes.”
That said, while we can’t with certainty predict what maple trees, or ponds, or ornamental plants will do in future years, it’s very clear that we’re in a period of rapid temperature change, and based on what we know of atmospheric science and human-caused emissions, there’s no reason to expect that change to stop any time soon.
As Betts recently told me, “climate change is on a roll and all we can do is slow it down, and give our societies and all of life on Earth more time to adapt.” In the meantime, I plan on placing my first ever bet on Joe’s Pond this year. What day I will bet on? That’s my secret; but it will certainly be earlier than I would have bet in 1997.
Discussion *